01 Opportunity
Fifteen packaging lines across two halls, each with a controller that already counted every box past the infeed. That number lived inside the controller and on the operator panel beside the line. Nobody in the office could see it, supervisors walked the floor to find out which line was behind, and the end-of-shift figure was typed into a spreadsheet from memory.
The plant had looked at cloud OEE subscriptions. The pitch was right: one count per line and you get state, rate, shift progress and downtime. The catch was a monthly fee per line, the data leaving the site, and yet another vendor box that nobody on site could maintain.
02 Solution
We took the same one-signal principle and built it on the plant’s own infrastructure. Each controller is read once and publishes its counts into an on-prem MQTT broker and a unified namespace. A small event store subscribes, decides each line’s state and keeps the history. The board is a page in a browser that subscribes to the same broker, so it is the same live number whether you open it in the control room, the office or on a phone in the yard.
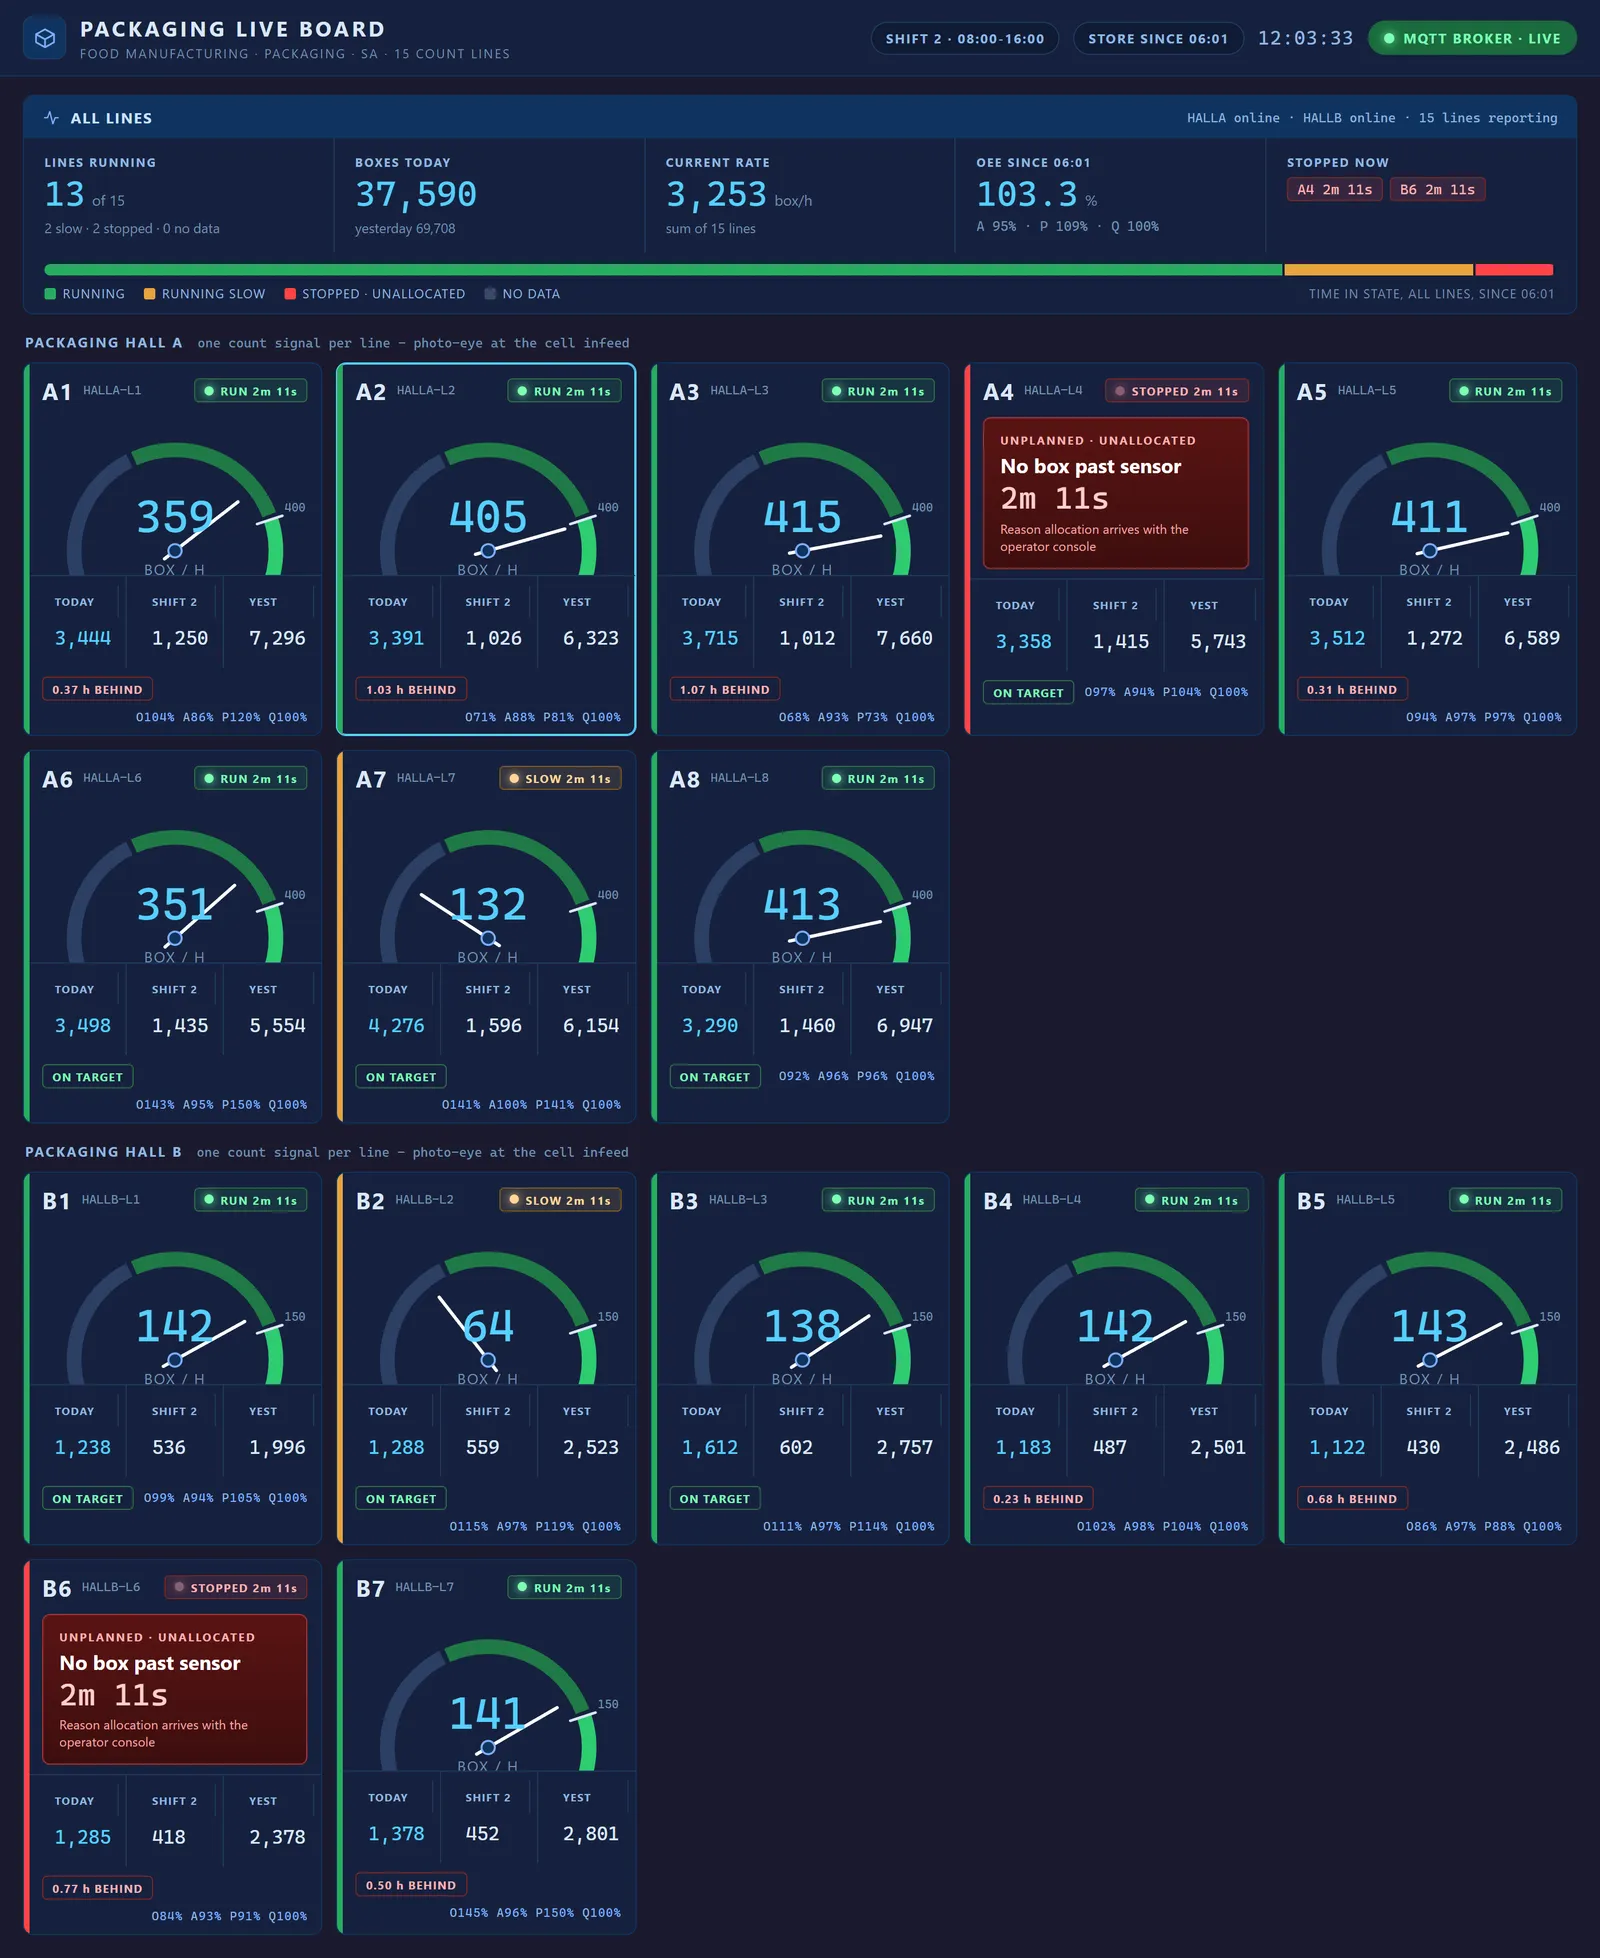
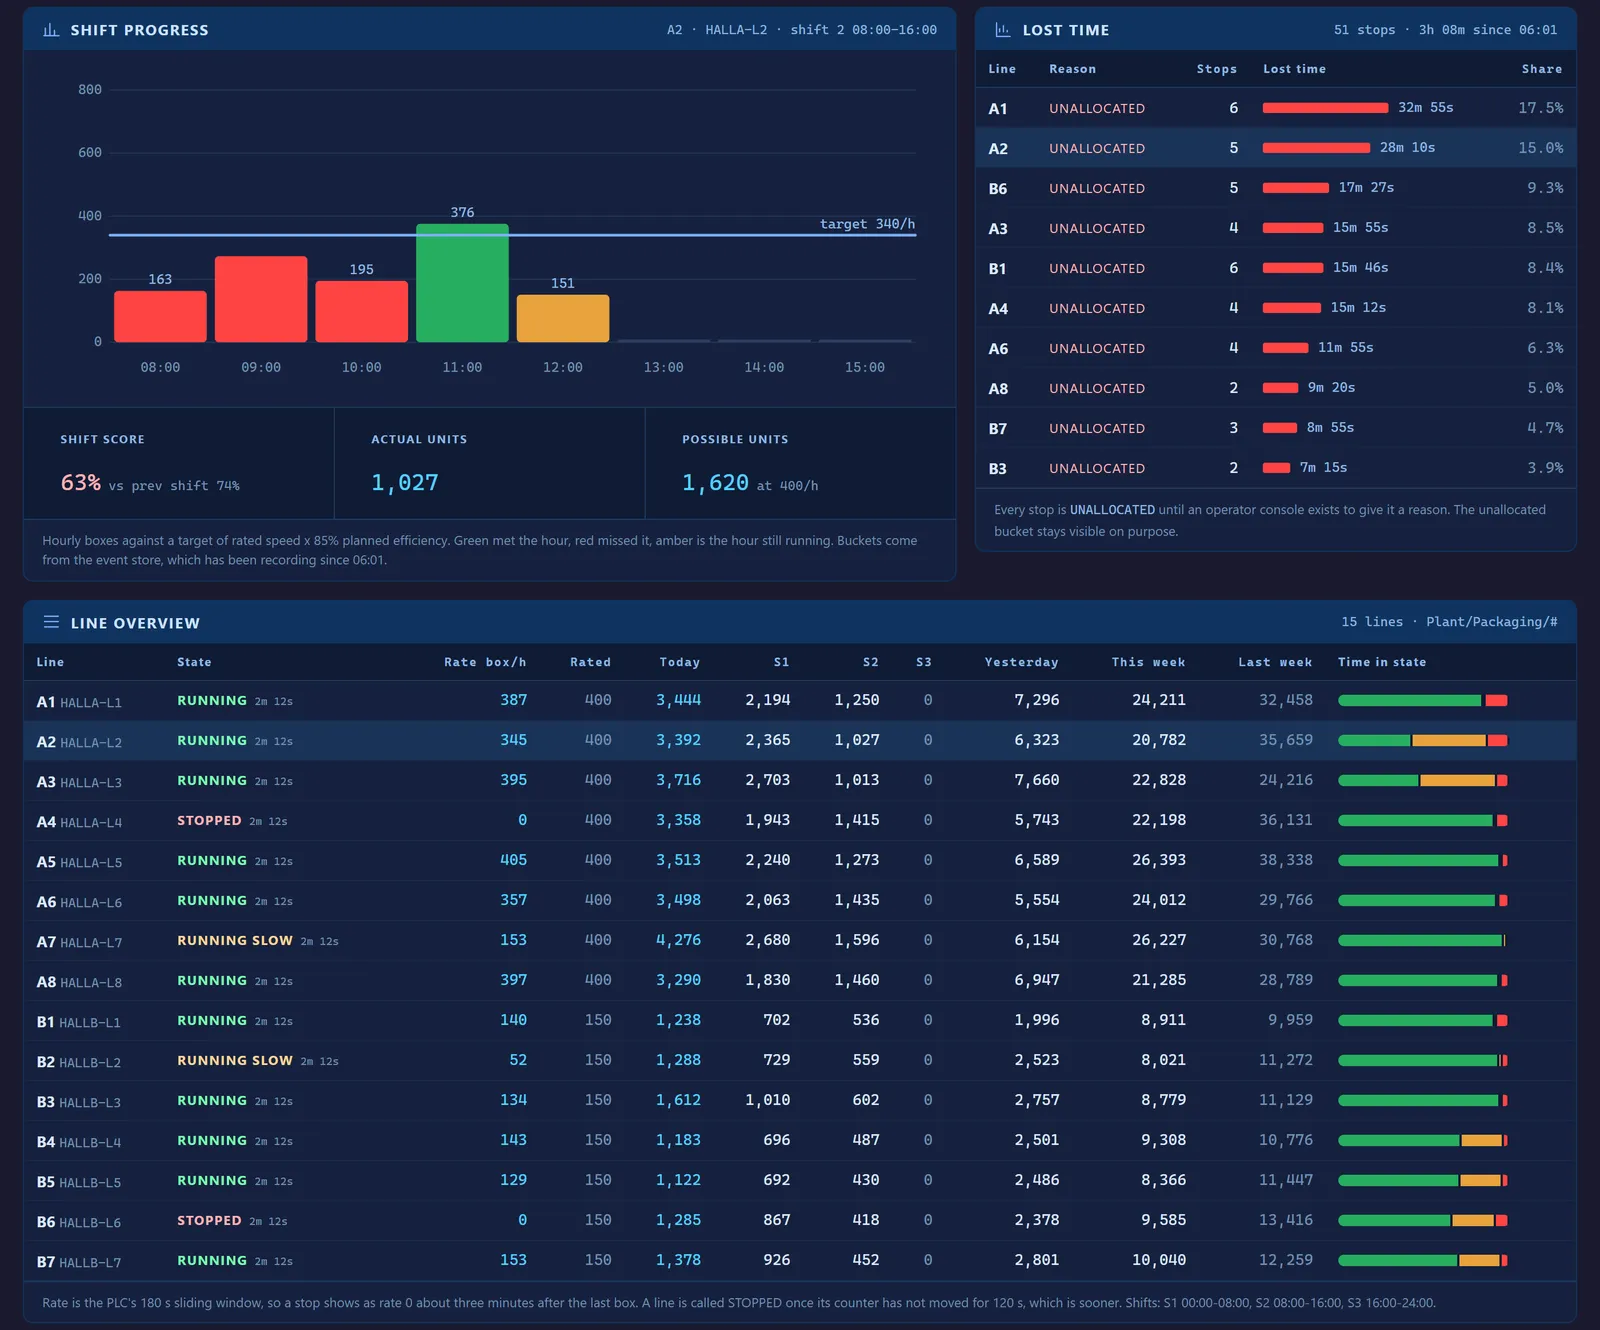
From one count per line, plus a table of rated speeds and shifts, the board derives everything: a rate gauge against rated speed, running / slow / stopped state, hourly boxes against target, a shift score against the previous shift, lost time by line and a plant-wide OEE with its availability, performance and quality split. Quality is shown at 100 percent and labelled that way, because there is no reject count yet. Nothing is invented.
Nothing was added to the lines. The counts existed; where a line has no count in its controller, one retrofit photo-eye is the whole hardware bill. The broker never writes back to a machine, which is what made the whole thing easy to approve.
03 Outcome
Fifteen lines on one screen, from the first shift the board went live. Supervisors see which line is behind and by how many hours without leaving the office, and the end-of-shift spreadsheet is gone. Every stop is visible and timed; the ones nobody has explained sit in their own “unallocated” bucket, which is the pressure that gets them explained.
Because the counts now live in a namespace rather than a screen, the same signal feeds the history, the AI assistant and any future board without another connection to a controller. The next step is the operator console that turns each stop into a reason, and a product table so performance is measured against the rated speed of what is actually running.
This is the Factory Data Backbone in its smallest useful form, with the Plant Dashboard Server as its first screen.
04 Project highlights
- Every figure on the board comes from one count per line plus a small table of rated speeds and shifts. No extra sensors, no PLC changes
- Running, running slow, stopped and no data decided in one place and shown the same way on every screen
- Shift progress hour by hour against a target, with a shift score against the previous shift, so the conversation happens at 10 am, not at month end
- Lost time by line, with unallocated stops shown as their own bucket until someone gives them a reason
- Honest by design: a line that stops reporting reads NO DATA, never the last good value
- Runs on the plant’s own broker and a small on-prem server. Any browser on site, no cloud account, no per-line subscription